
STORE REPORTING PACKAGE (follows this page)
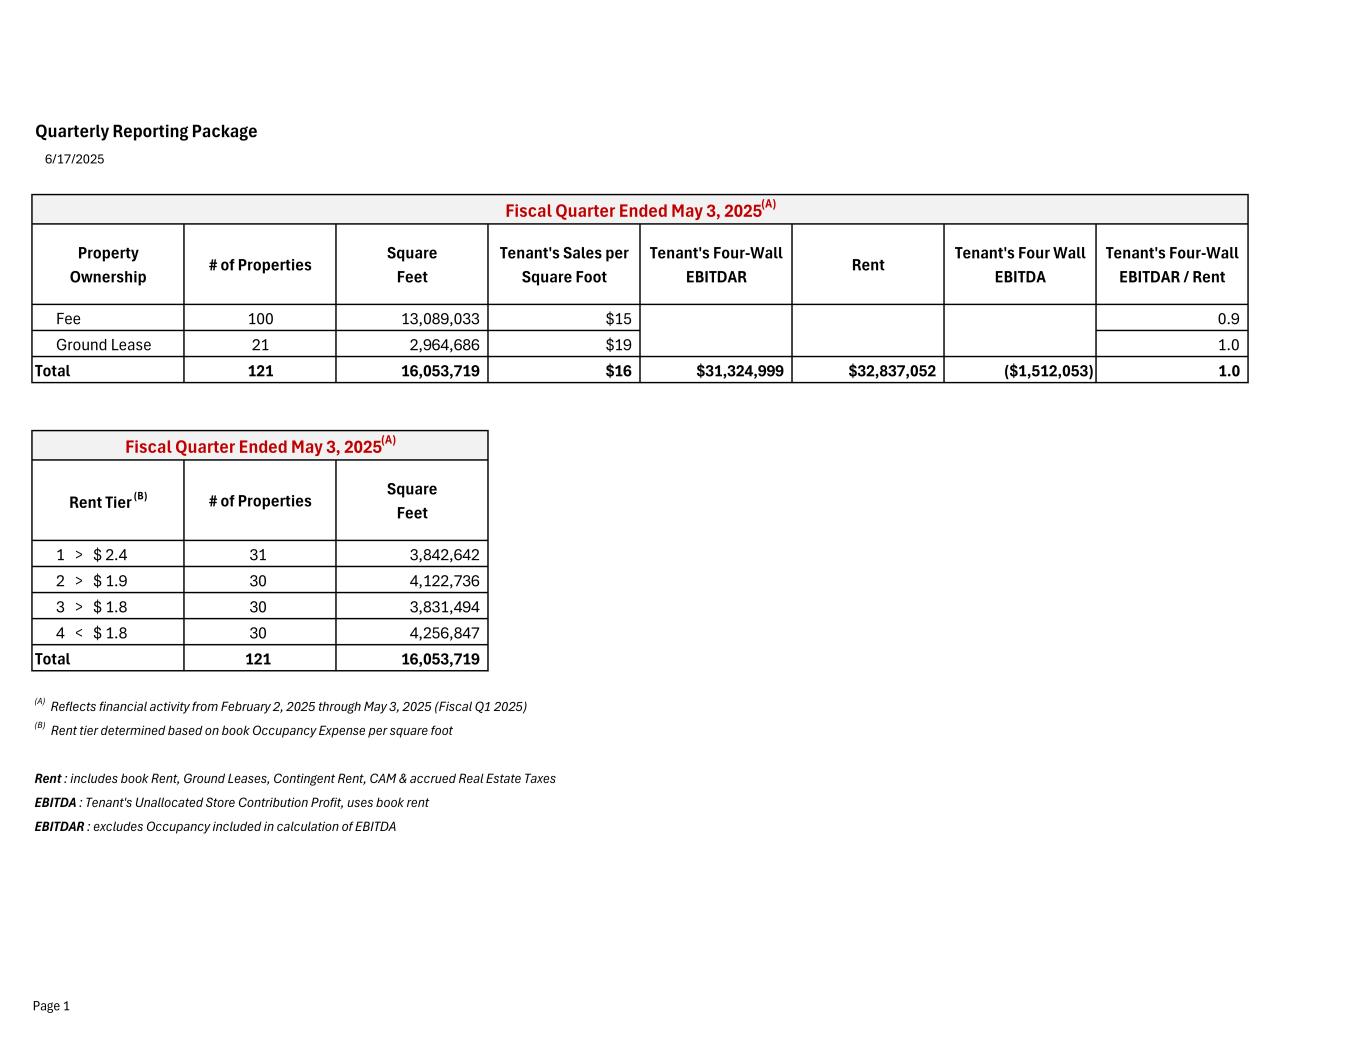
Quarterly Reporting Package 6/17/2025 Property Ownership # of Properties Square Feet Tenant's Sales per Square Foot Tenant's Four-Wall EBITDAR Rent Tenant's Four Wall EBITDA Tenant's Four-Wall EBITDAR / Rent Fee 100 13,089,033 $15 $23,656,699 $25,431,722 ($1,775,023) 0.9 Ground Lease 21 2,964,686 $19 $7,668,300 $7,405,330 $262,971 1.0 Total 121 16,053,719 $16 $31,324,999 $32,837,052 ($1,512,053) 1.0 Rent Tier (B) # of Properties Square Feet 1 > $ 2.4 31 3,842,642 2 > $ 1.9 30 4,122,736 3 > $ 1.8 30 3,831,494 4 < $ 1.8 30 4,256,847 Total 121 16,053,719 (A) Reflects financial activity from February 2, 2025 through May 3, 2025 (Fiscal Q1 2025) (B) Rent tier determined based on book Occupancy Expense per square foot Rent : includes book Rent, Ground Leases, Contingent Rent, CAM & accrued Real Estate Taxes EBITDA : Tenant's Unallocated Store Contribution Profit, uses book rent EBITDAR : excludes Occupancy included in calculation of EBITDA Fiscal Quarter Ended May 3, 2025(A) Fiscal Quarter Ended May 3, 2025(A) Page 1
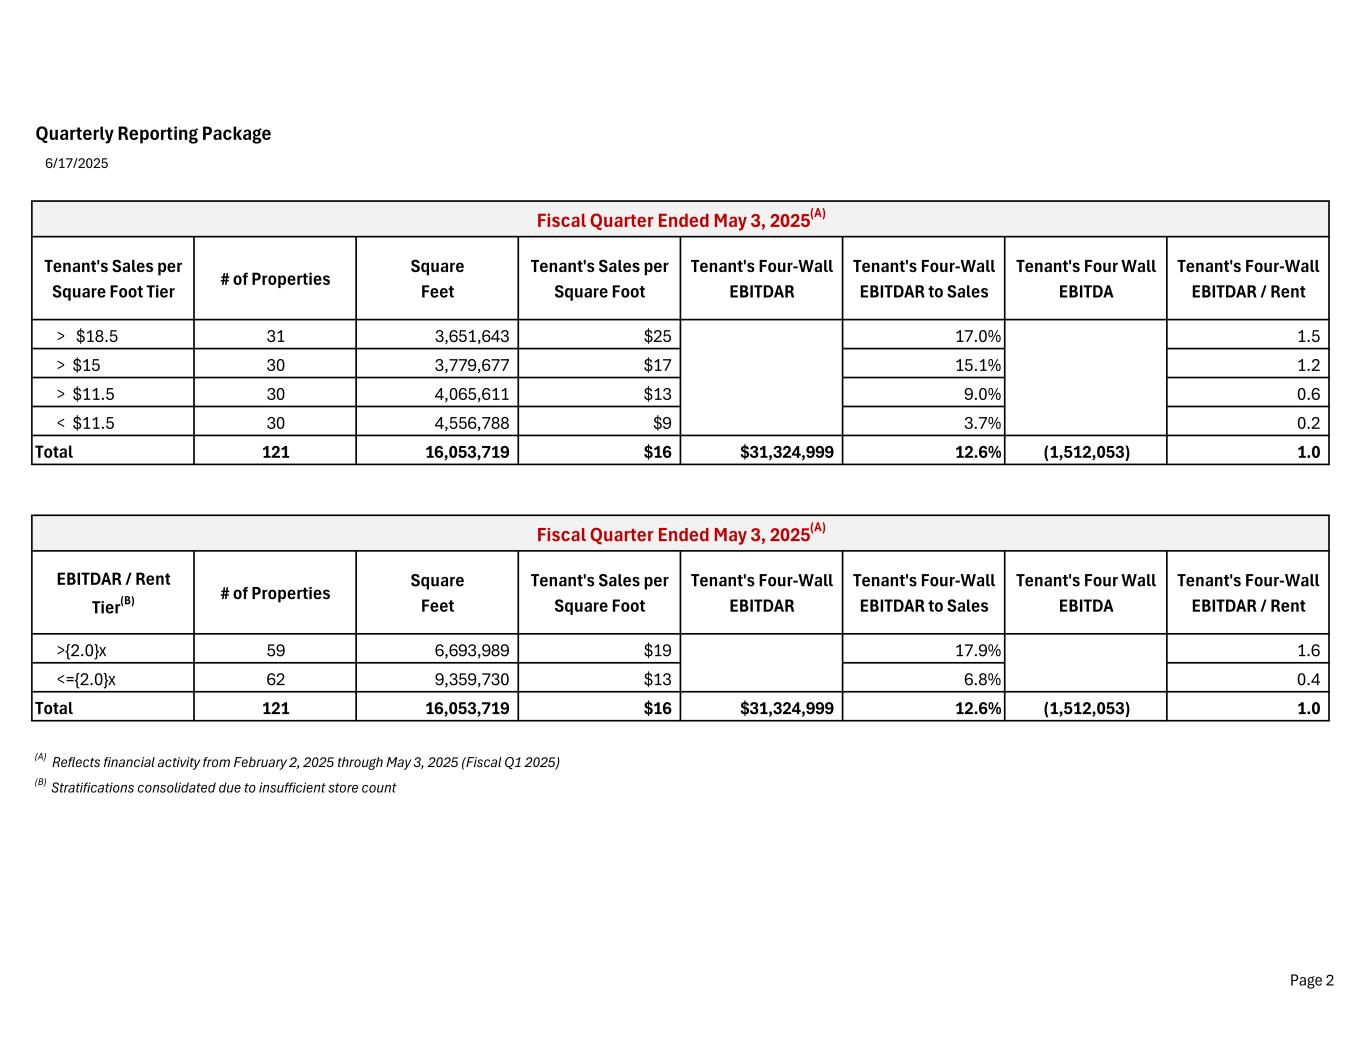
Quarterly Reporting Package 6/17/2025 Tenant's Sales per Square Foot Tier # of Properties Square Feet Tenant's Sales per Square Foot Tenant's Four-Wall EBITDAR Tenant's Four-Wall EBITDAR to Sales Tenant's Four Wall EBITDA Tenant's Four-Wall EBITDAR / Rent > $18.5 31 3,651,643 $25 17.0% 1.5 > $15 30 3,779,677 $17 15.1% 1.2 > $11.5 30 4,065,611 $13 9.0% 0.6 < $11.5 30 4,556,788 $9 3.7% 0.2 Total 121 16,053,719 $16 $31,324,999 12.6% (1,512,053) 1.0 EBITDAR / Rent Tier(B) # of Properties Square Feet Tenant's Sales per Square Foot Tenant's Four-Wall EBITDAR Tenant's Four-Wall EBITDAR to Sales Tenant's Four Wall EBITDA Tenant's Four-Wall EBITDAR / Rent >{2.0}x 59 6,693,989 $19 17.9% 1.6 <={2.0}x 62 9,359,730 $13 6.8% 0.4 Total 121 16,053,719 $16 $31,324,999 12.6% (1,512,053) 1.0 (A) Reflects financial activity from February 2, 2025 through May 3, 2025 (Fiscal Q1 2025) (B) Stratifications consolidated due to insufficient store count Fiscal Quarter Ended May 3, 2025(A) Fiscal Quarter Ended May 3, 2025(A) Page 2
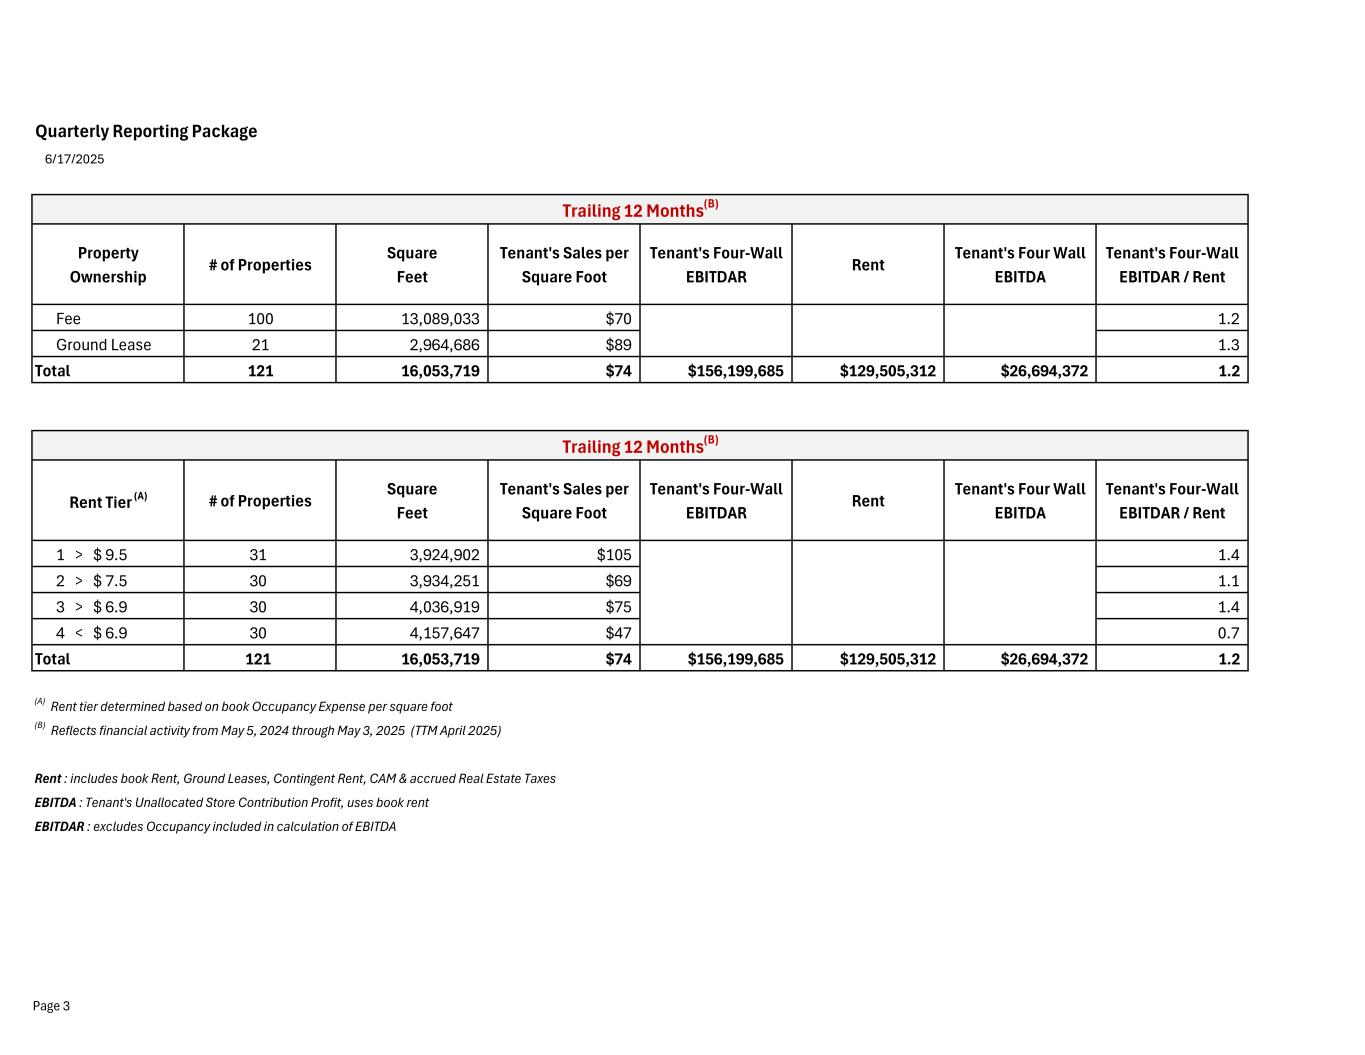
Quarterly Reporting Package 6/17/2025 Property Ownership # of Properties Square Feet Tenant's Sales per Square Foot Tenant's Four-Wall EBITDAR Rent Tenant's Four Wall EBITDA Tenant's Four-Wall EBITDAR / Rent Fee 100 13,089,033 $70 $117,858,162 $100,279,109 $17,579,053 1.2 Ground Lease 21 2,964,686 $89 $38,341,522 $29,226,203 $9,115,319 1.3 Total 121 16,053,719 $74 $156,199,685 $129,505,312 $26,694,372 1.2 Rent Tier (A) # of Properties Square Feet Tenant's Sales per Square Foot Tenant's Four-Wall EBITDAR Rent Tenant's Four Wall EBITDA Tenant's Four-Wall EBITDAR / Rent 1 > $ 9.5 31 3,924,902 $105 $63,093,192 $46,518,261 1.4 2 > $ 7.5 30 3,934,251 $69 $36,498,143 $33,099,654 1.1 3 > $ 6.9 30 4,036,919 $75 $41,232,702 $28,955,209 1.4 4 < $ 6.9 30 4,157,647 $47 $15,375,648 $20,932,188 0.7 Total 121 16,053,719 $74 $156,199,685 $129,505,312 $26,694,372 1.2 (A) Rent tier determined based on book Occupancy Expense per square foot (B) Reflects financial activity from May 5, 2024 through May 3, 2025 (TTM April 2025) Rent : includes book Rent, Ground Leases, Contingent Rent, CAM & accrued Real Estate Taxes EBITDA : Tenant's Unallocated Store Contribution Profit, uses book rent EBITDAR : excludes Occupancy included in calculation of EBITDA Trailing 12 Months(B) Trailing 12 Months(B) Page 3
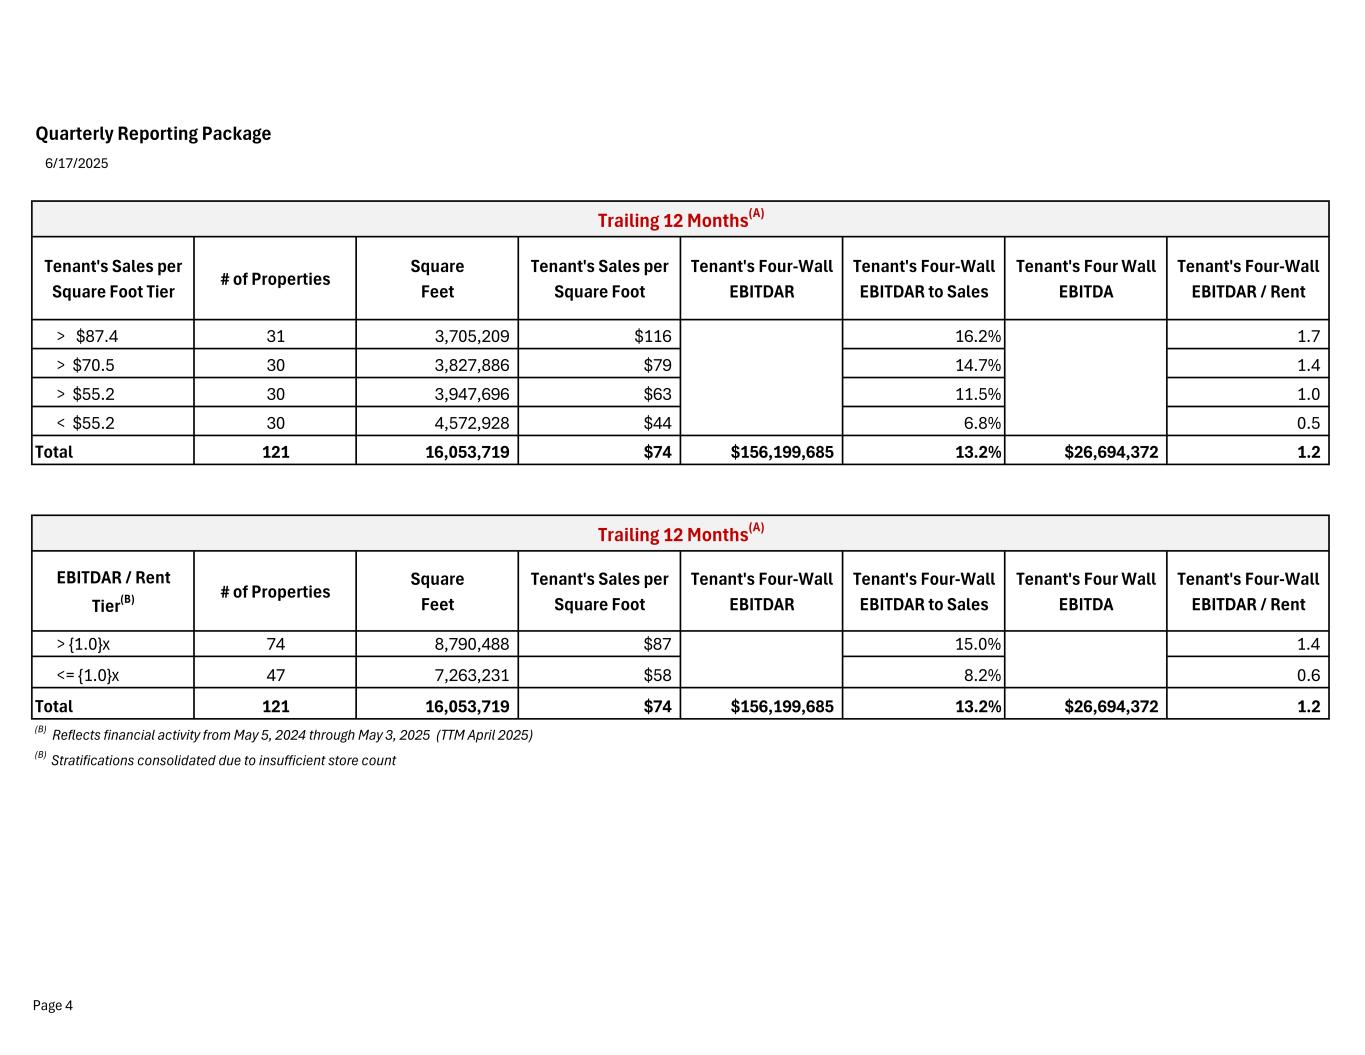
Quarterly Reporting Package 6/17/2025 Tenant's Sales per Square Foot Tier # of Properties Square Feet Tenant's Sales per Square Foot Tenant's Four-Wall EBITDAR Tenant's Four-Wall EBITDAR to Sales Tenant's Four Wall EBITDA Tenant's Four-Wall EBITDAR / Rent > $87.4 31 3,705,209 $116 16.2% 1.7 > $70.5 30 3,827,886 $79 14.7% 1.4 > $55.2 30 3,947,696 $63 11.5% 1.0 < $55.2 30 4,572,928 $44 6.8% 0.5 Total 121 16,053,719 $74 $156,199,685 13.2% $26,694,372 1.2 EBITDAR / Rent Tier(B) # of Properties Square Feet Tenant's Sales per Square Foot Tenant's Four-Wall EBITDAR Tenant's Four-Wall EBITDAR to Sales Tenant's Four Wall EBITDA Tenant's Four-Wall EBITDAR / Rent > {1.0}x 74 8,790,488 $87 15.0% 1.4 <= {1.0}x 47 7,263,231 $58 8.2% 0.6 Total 121 16,053,719 $74 $156,199,685 13.2% $26,694,372 1.2 (B) Reflects financial activity from May 5, 2024 through May 3, 2025 (TTM April 2025) (B) Stratifications consolidated due to insufficient store count Trailing 12 Months(A) Trailing 12 Months(A) Page 4
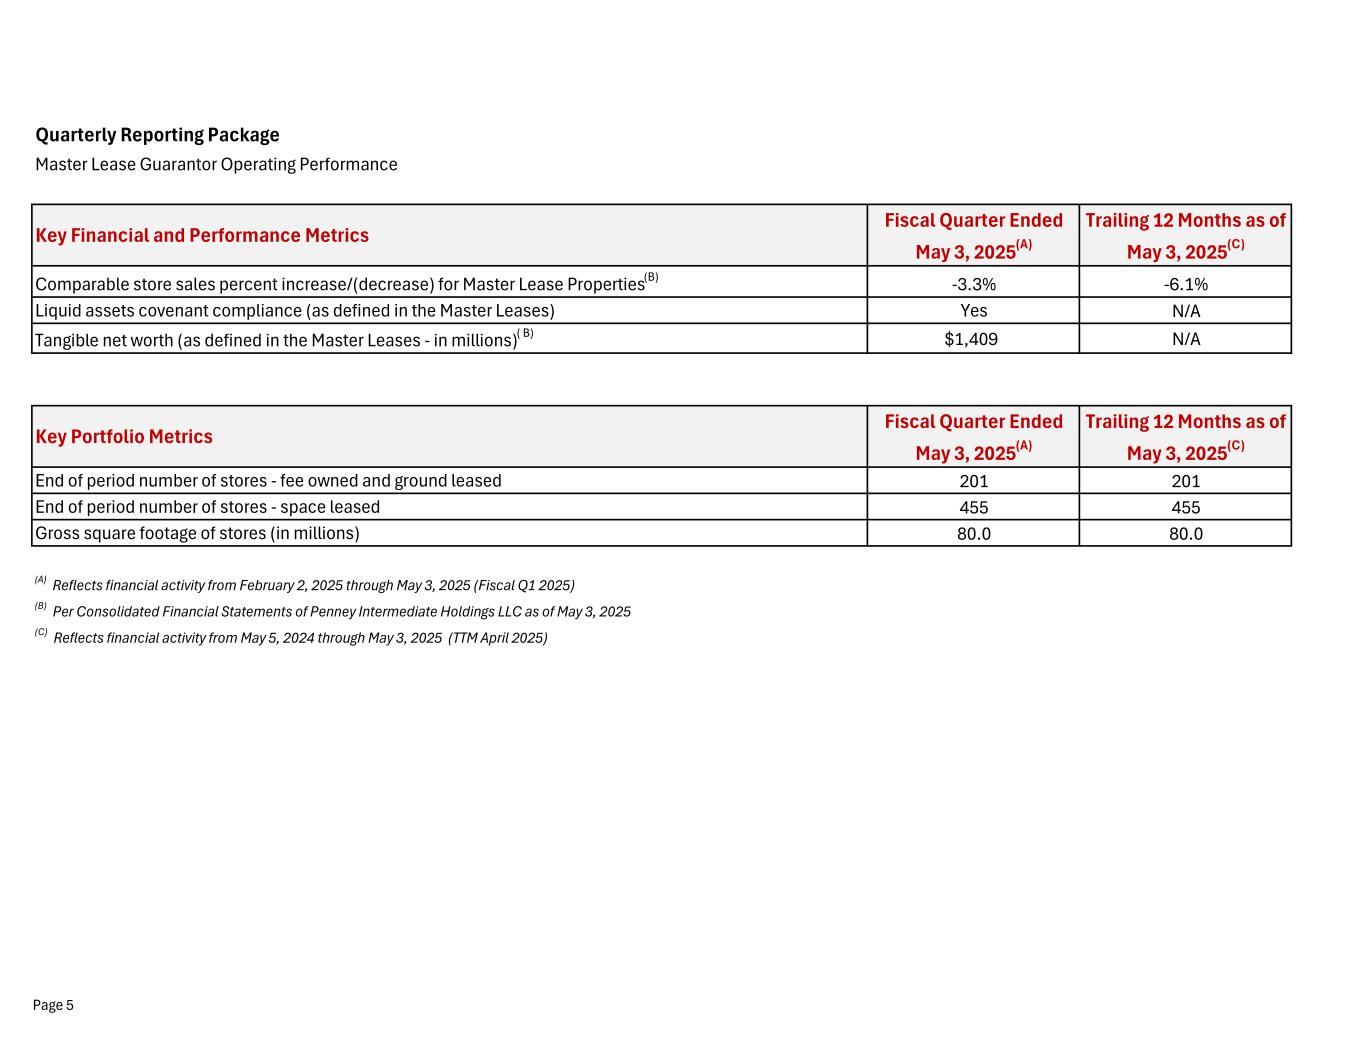
Quarterly Reporting Package Master Lease Guarantor Operating Performance Fiscal Quarter Ended May 3, 2025(A) Trailing 12 Months as of May 3, 2025(C) -3.3% -6.1% Yes N/A $1,409 N/A Fiscal Quarter Ended May 3, 2025(A) Trailing 12 Months as of May 3, 2025(C) 201 201 455 455 80.0 80.0 (A) Reflects financial activity from February 2, 2025 through May 3, 2025 (Fiscal Q1 2025) (B) Per Consolidated Financial Statements of Penney Intermediate Holdings LLC as of May 3, 2025 (C) Reflects financial activity from May 5, 2024 through May 3, 2025 (TTM April 2025) End of period number of stores - space leased Gross square footage of stores (in millions) Key Financial and Performance Metrics Comparable store sales percent increase/(decrease) for Master Lease Properties(B) Liquid assets covenant compliance (as defined in the Master Leases) Tangible net worth (as defined in the Master Leases - in millions)( B) Key Portfolio Metrics End of period number of stores - fee owned and ground leased Page 5